PROJECTS
Crypto Radar
PROJECT SUMMARY
Building a market intelligence platform that collects and analyzes real-time data to identify promising trading setups and opportunities.
The platform will include:
Machine learning models that analyze historical market data to identify patterns and forecast potential trading opportunities.
Technical indicator screener that evaluates current market indicators across a wide range of assets, helping traders efficiently identify favorable setups.
Candlestick pattern screener that scans live market data for bullish and bearish candlestick patterns.
MACHINE LEARNING MODELS
Description
The platform uses Random Forest machine learning models to analyze historical and current market data across multiple timeframes. Separate models evaluate potential long and short opportunities using price action, momentum, trend, volatility, volume, and technical indicators such as RSI, MACD, moving averages, ATR, Bollinger Band Width, and ADX.
Each model estimates the probability of a defined upward or downward price movement occurring within a specified future period. Trading signals are generated only when a prediction exceeds a threshold established from the model’s historical performance.
Backtesting
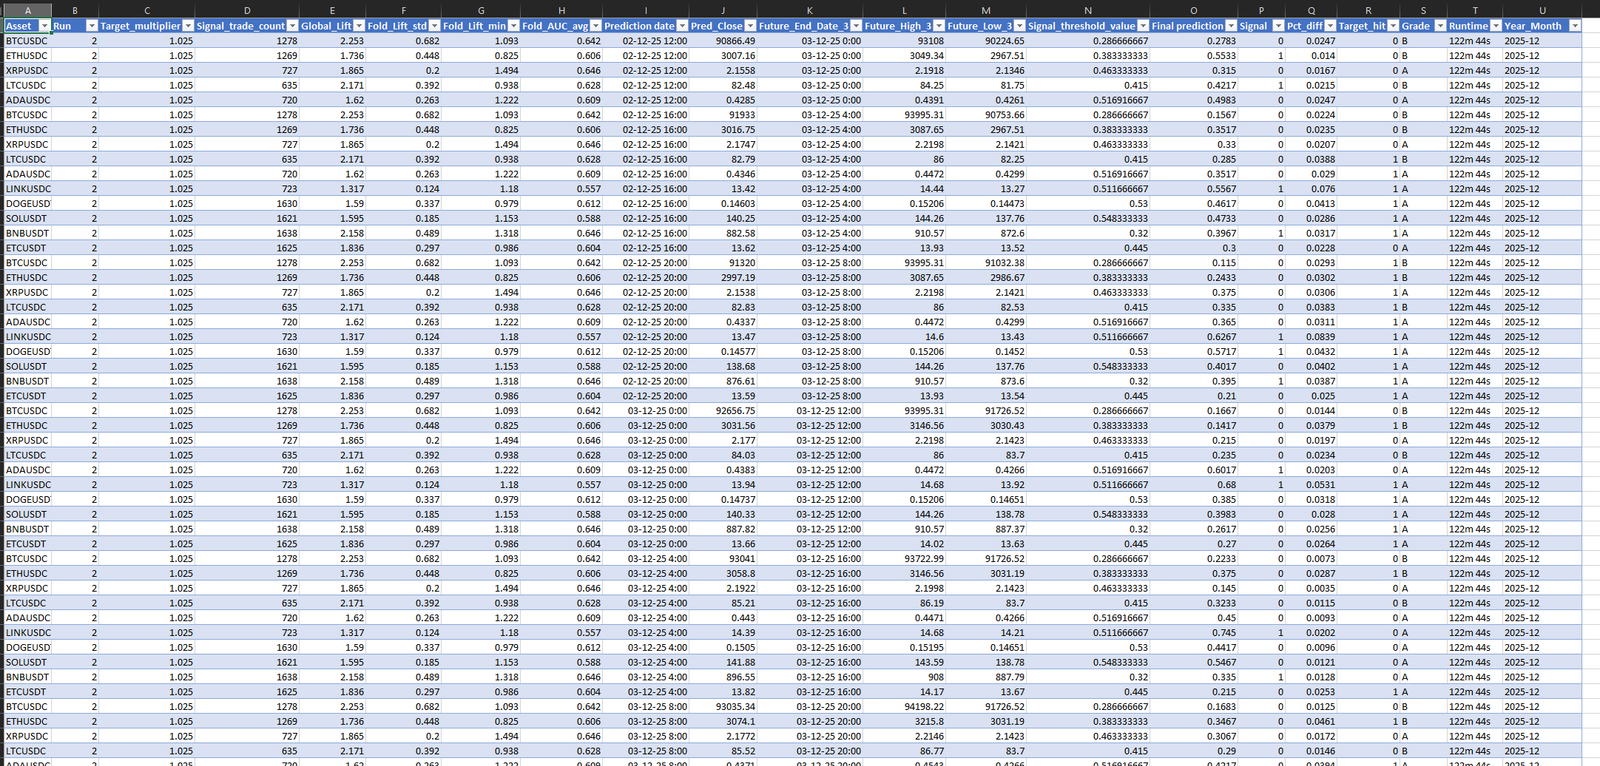
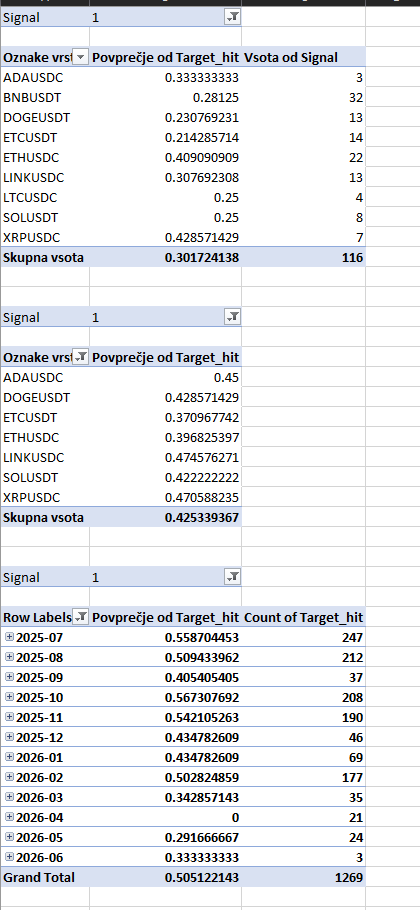
The models are evaluated using walk-forward backtesting, which preserves the chronological order of market data and simulates how each model would have performed on previously unseen periods. Models are repeatedly trained on past data, tested on the following period, and retrained as the evaluation moves forward through time.
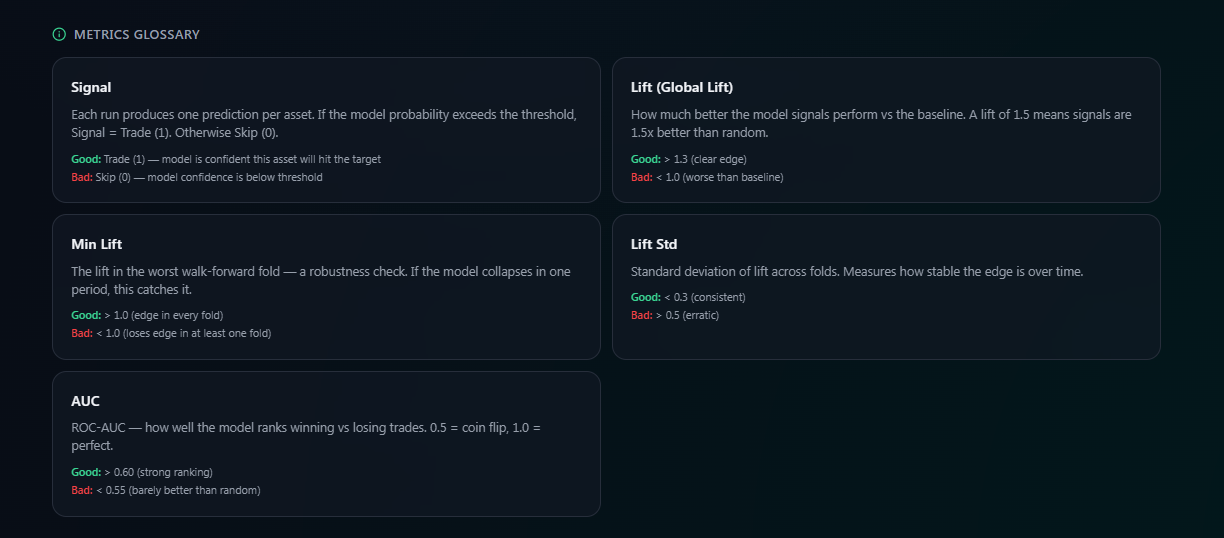
Performance is assessed using metrics such as:
- Historical signal hit rate
- Lift over the baseline market probability
- ROC-AUC
- Consistency across testing periods
- Number of historical signals
Presentation on the platform
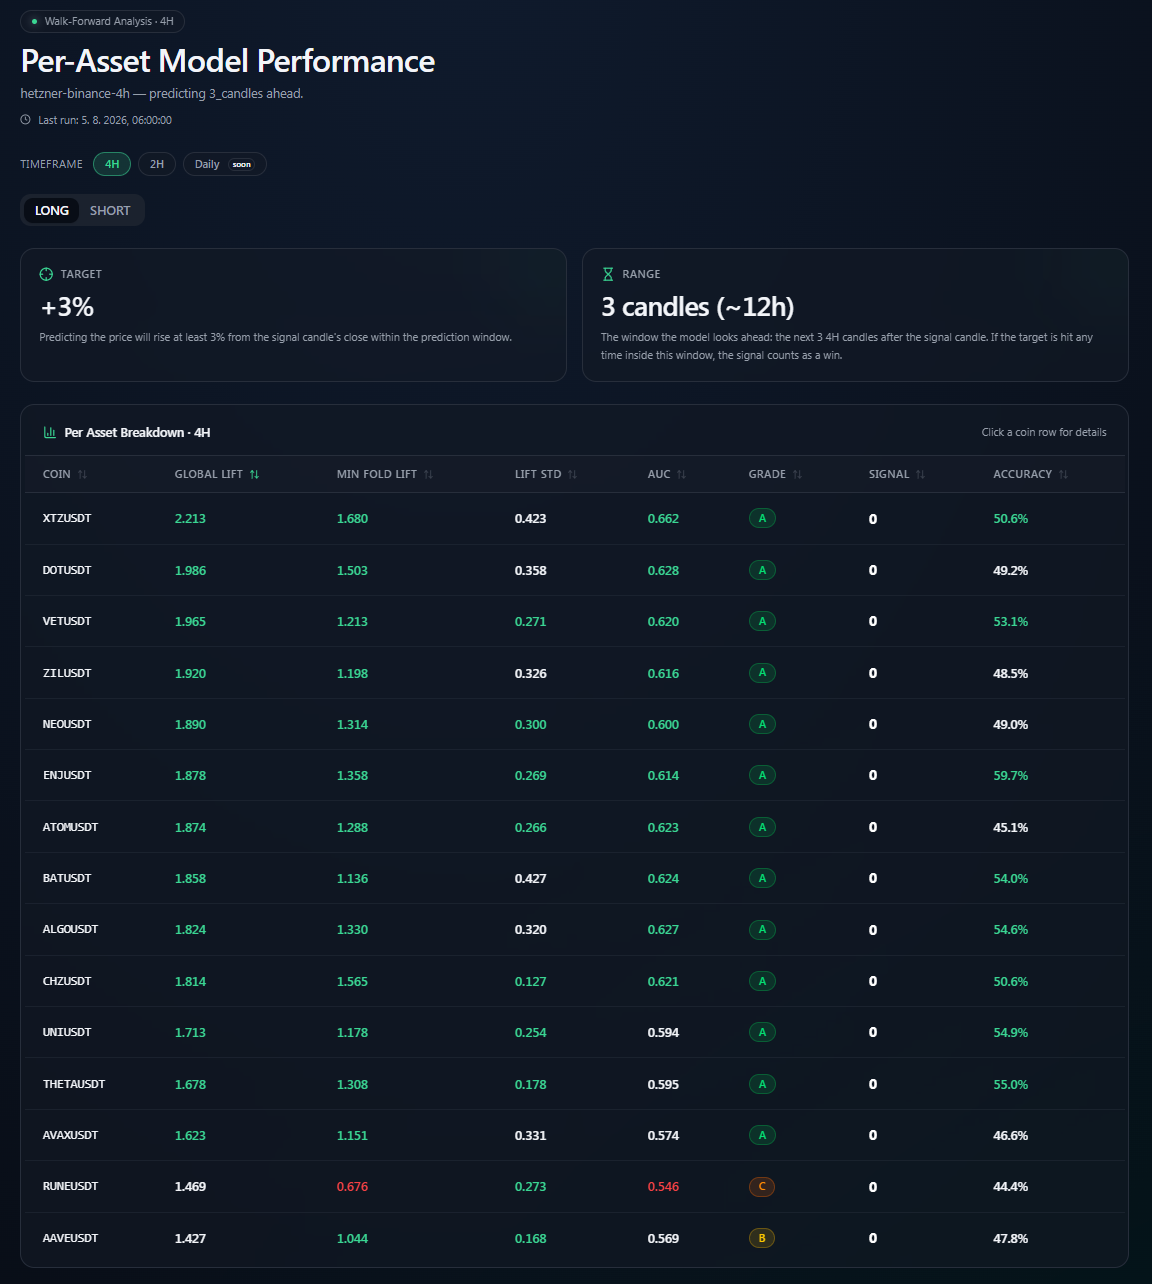
The platform brings the results from different assets, timeframes, and trade directions into a clear interface. Users can view:
- Predicted probability
- Long or short signal
- Relevant timeframe
- Historical hit rate and lift
- Signal threshold
- Model stability and performance
- Overall model quality grade
This allows traders to compare opportunities across the market and identify conditions supported by historical statistical evidence. The models are designed as decision-support tools and do not guarantee future performance.
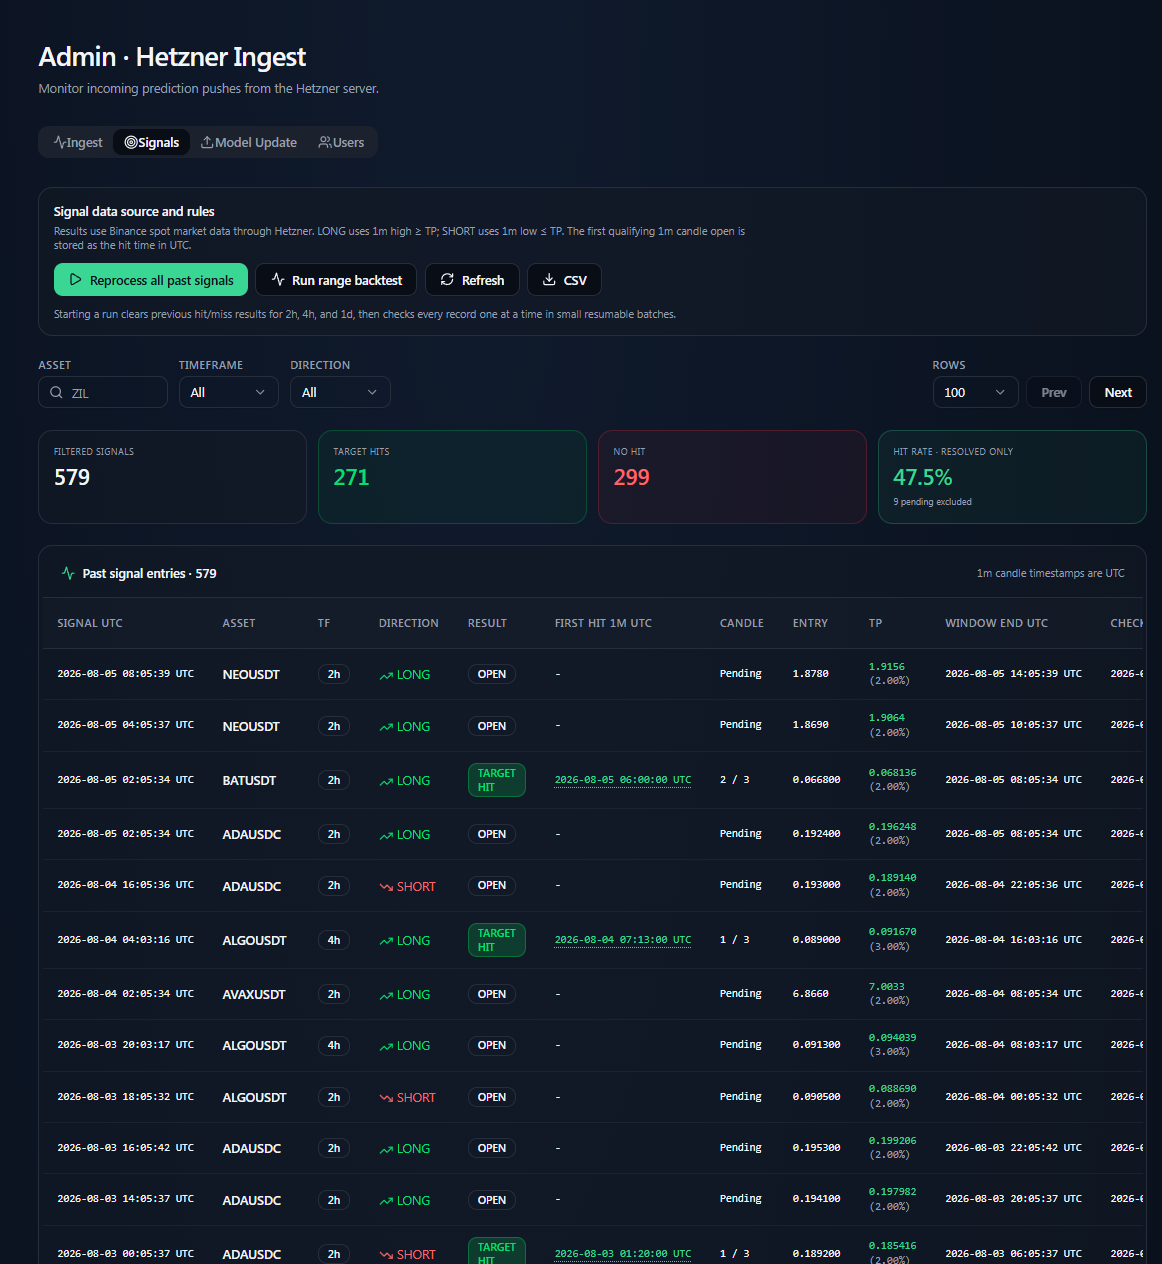
We are currently developing a live model-performance tracker that will allow users to evaluate the accuracy of our machine learning predictions. Every prediction generated by the platform will be recorded, along with its target, timeframe, and final outcome. Users will be able to see whether the predicted price target was reached within the specified period, providing a transparent view of the model’s real-world performance over time.
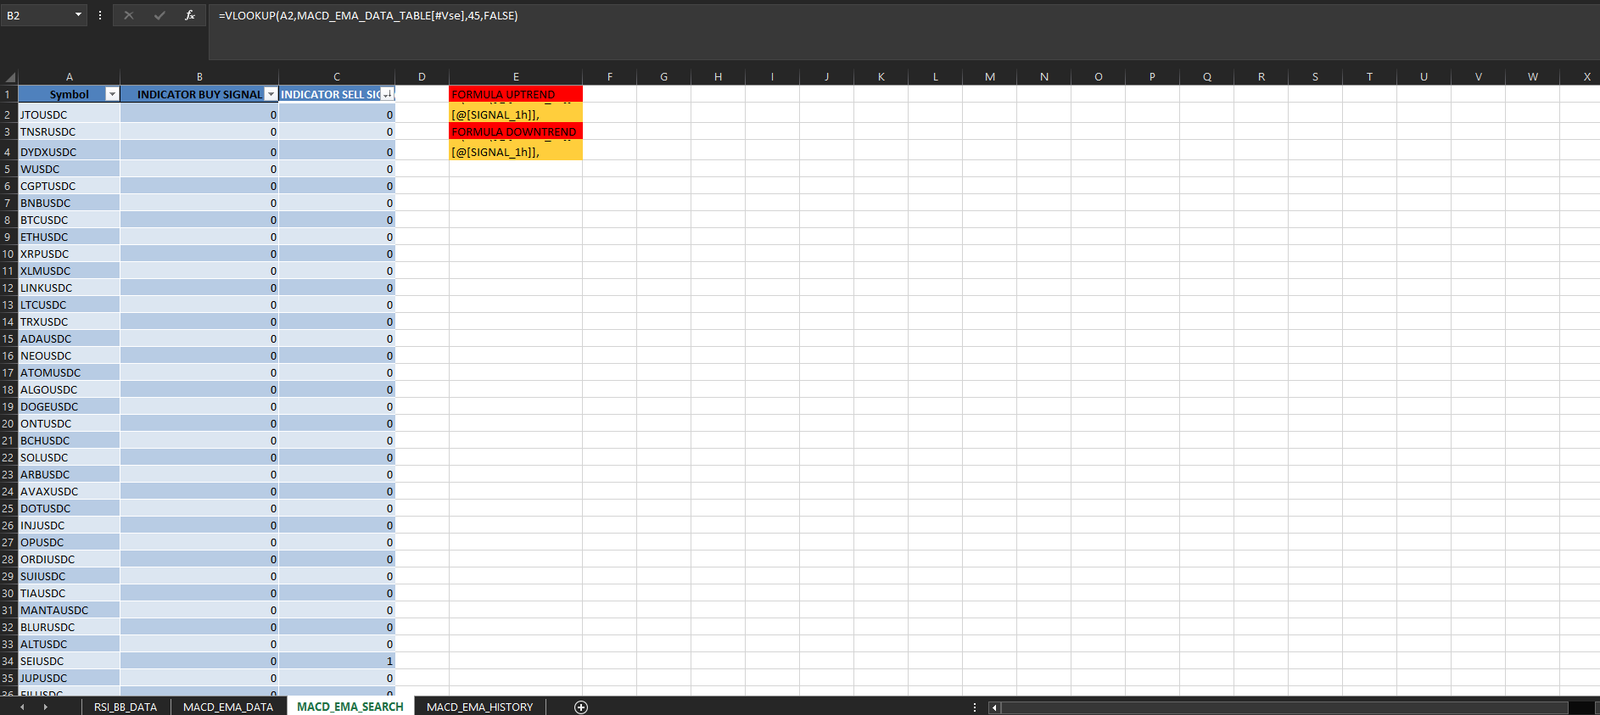
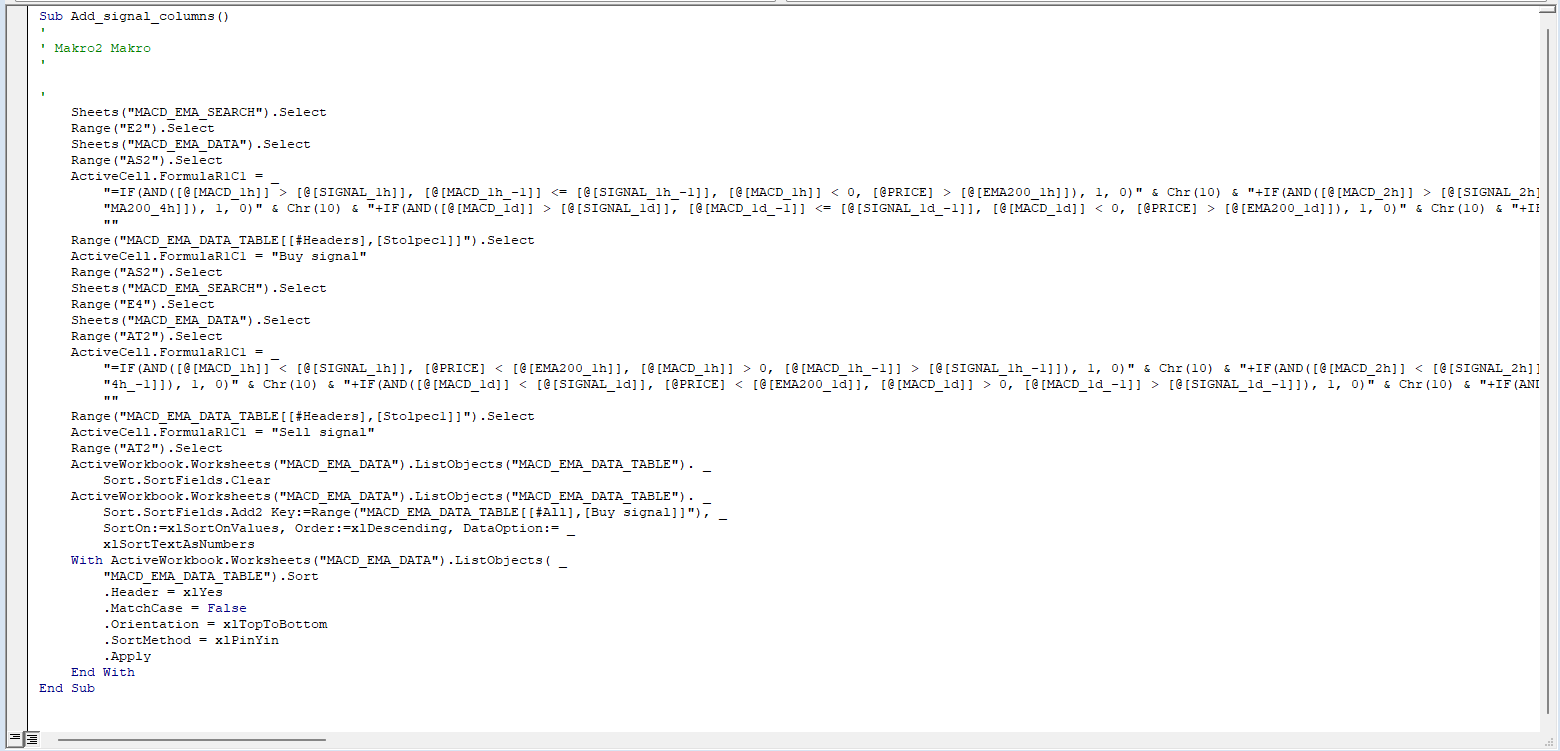
The script kept overwriting my data every time it ran. So instead of complicating things in the script i added macros to my excel file and made the script run them so that the excel formulas looking for the indicator signals run and the columns appended to the end of the data table. I also added an extra sheet where I stored the formulas and used VLOOKUP to create another table just with the formulas results as the previous tables have a lot of columns and is a bit more inconvenient to search for data there.
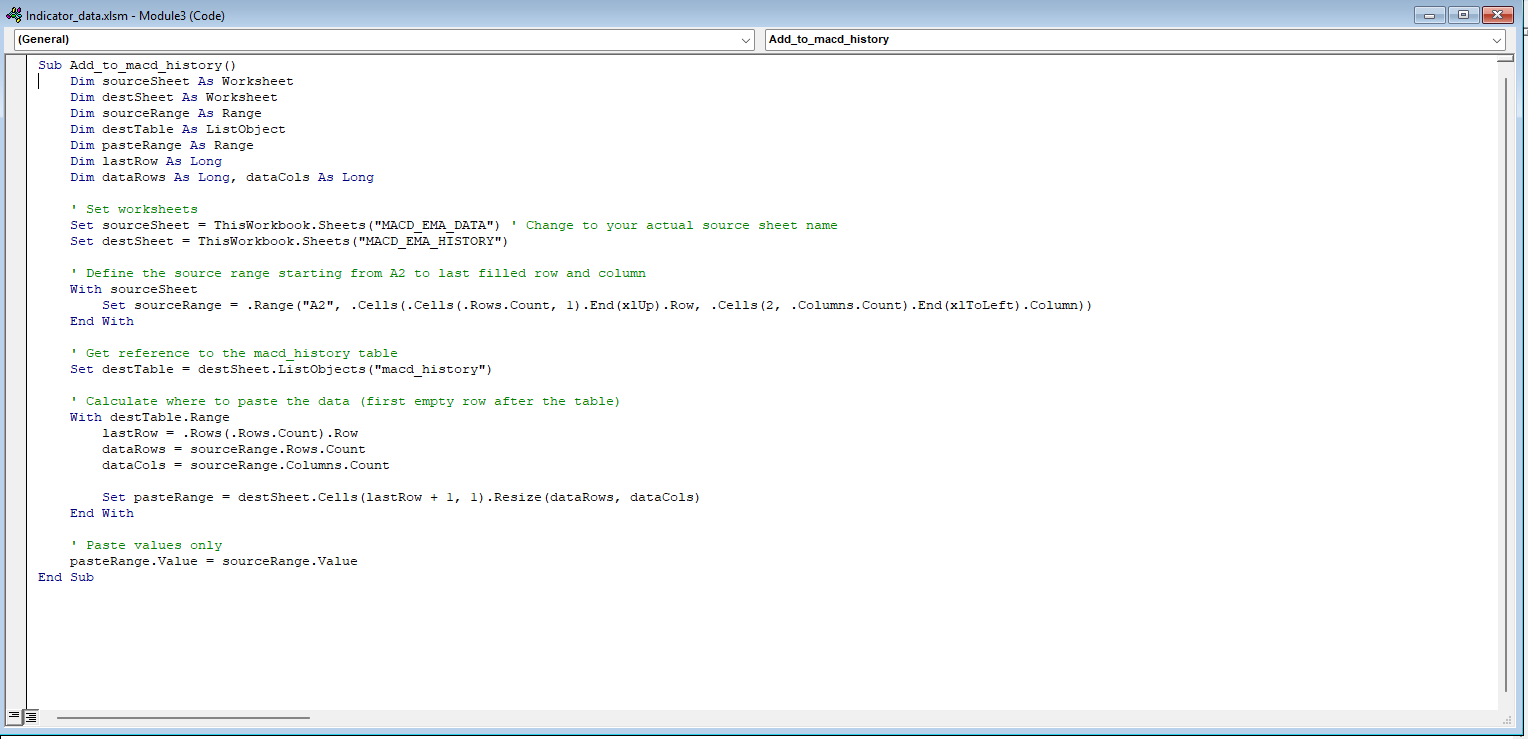
I added another macro to run at the end of the script that will always append the new data collected to the MACD_EMA_HISTORY table so I can later do analysis on past data.
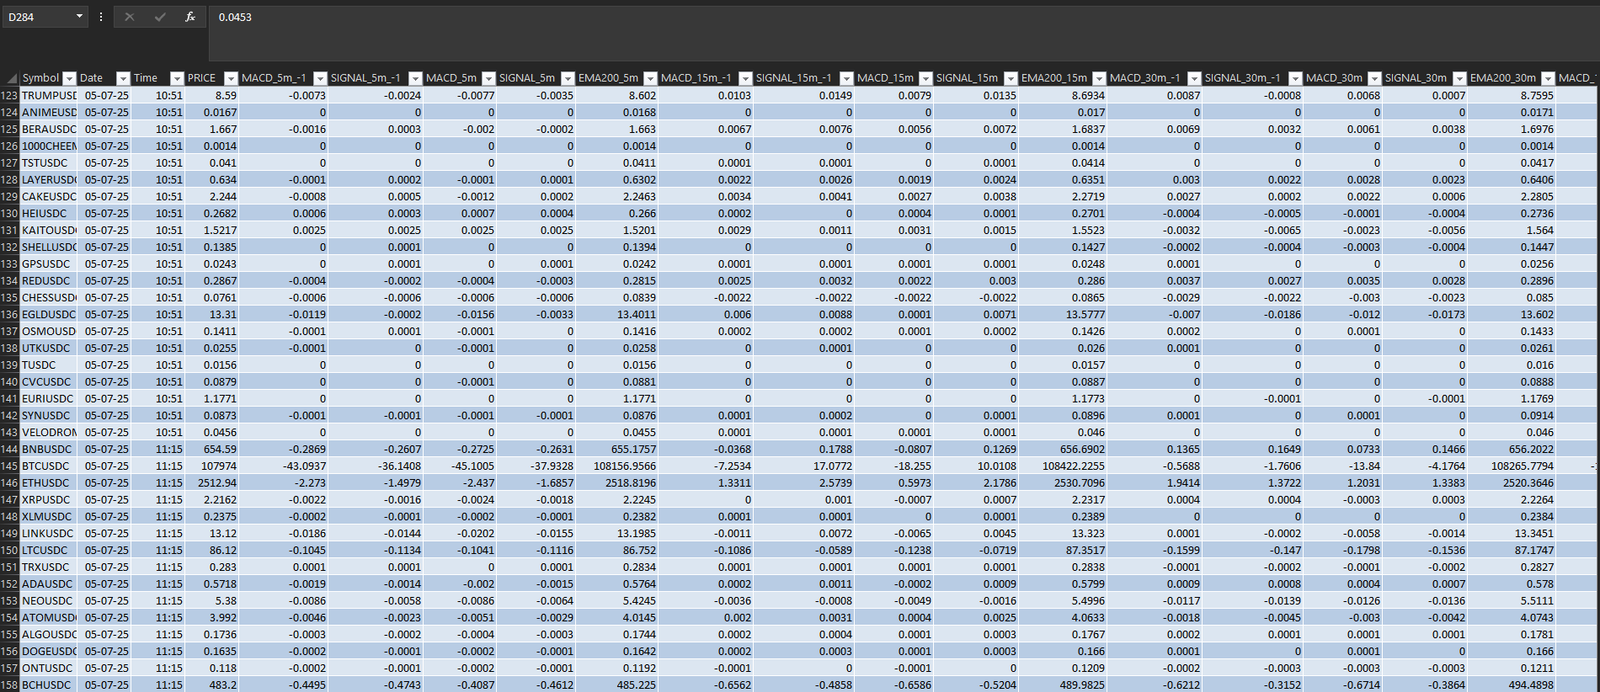
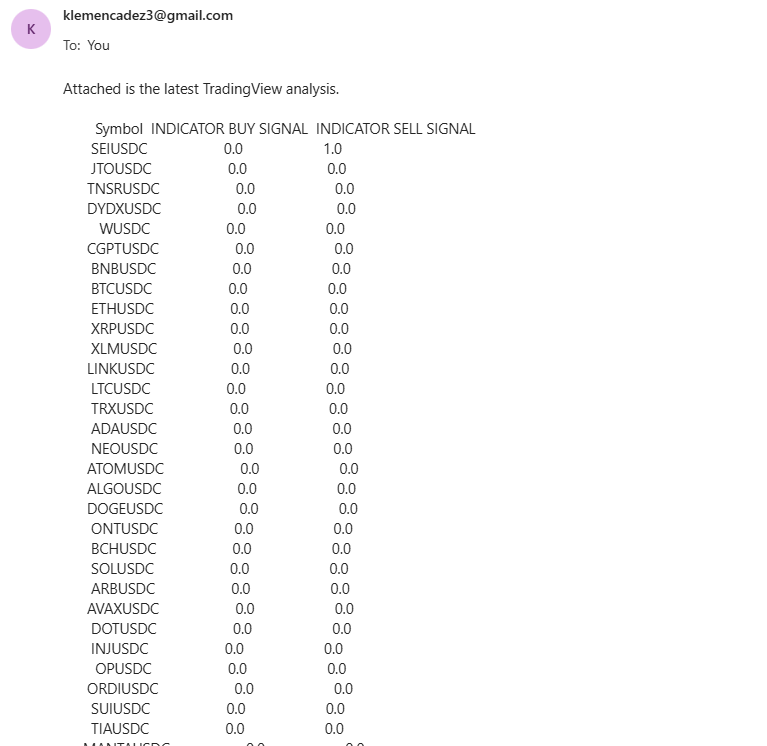
I have updated my script to send me the dataframe on e-mail sorted with the rows that meet the criteria at the top. This way I keep getting updated with new trading opportunities on my e-mail every time the code runs.